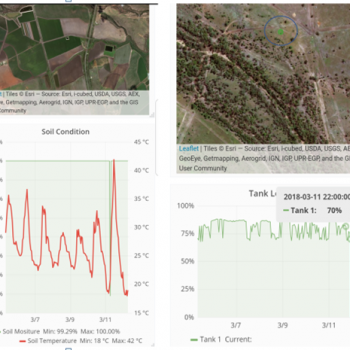
The two screen shots opposite are from the farmers mobile phone.
The first shows soil temperature and moister content.(Note: Saturated due to heavy rain).
The other shows the geo-location of a trough or tank and shows the water level trend over the previous week.(Note: The tank circled in Red). As it is colored green the water tank is showing average safe levels. The level dips indicate when animals drank from there.

